Infographics
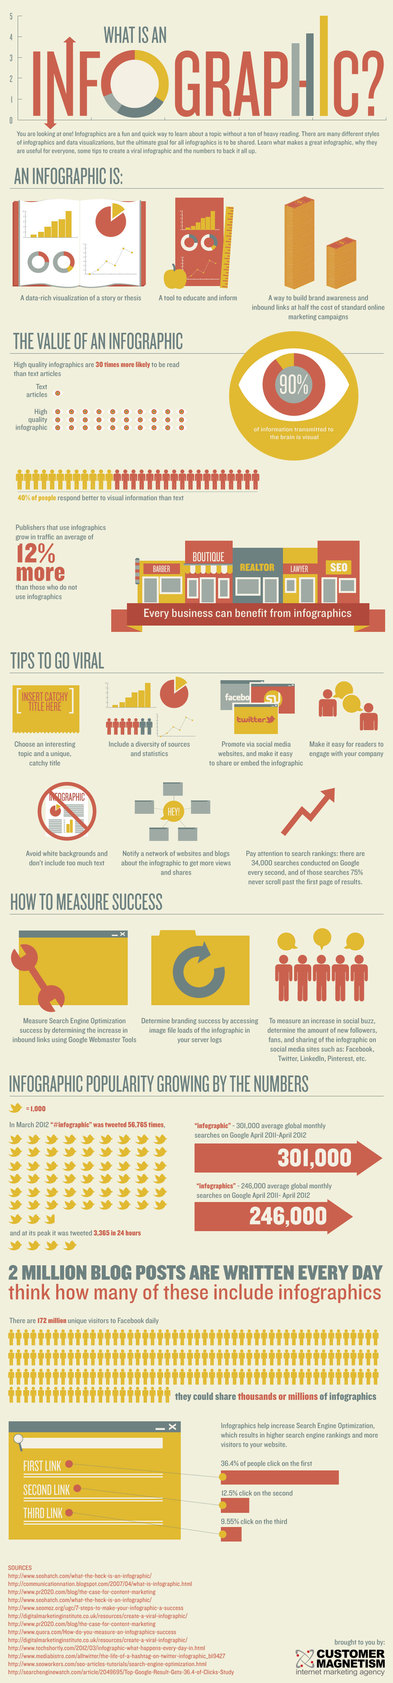
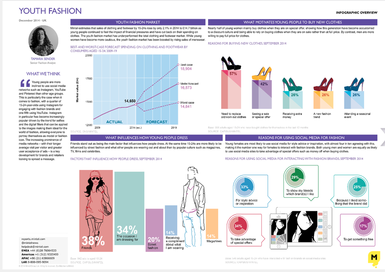
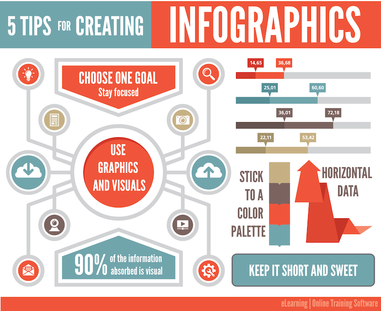
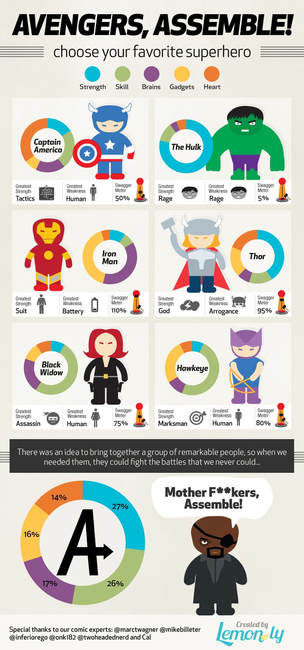
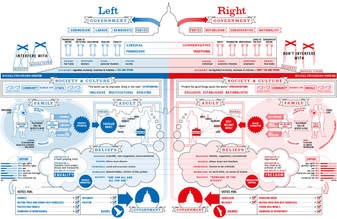
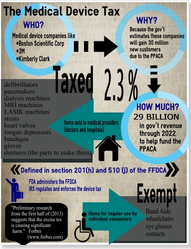
Information graphics, infographics, are graphic visual representations of information, data or knowledge. People create them (often in marketing and technical publications) to present information quickly and clearly. They can improve understanding by using graphics to enhance the visual system's ability to see patterns and trends.
An infographic should be visually engaging and contain a subject matter and data that is appealing to your target audience.
After viewing the examples here, scroll to the bottom for links to information on how to create your inforgraphic.
An infographic should be visually engaging and contain a subject matter and data that is appealing to your target audience.
After viewing the examples here, scroll to the bottom for links to information on how to create your inforgraphic.
|
|
I encourage you to read these articles as well as do your own research.
Many sites exist such as visual.ly, canva, piktochart, easel.ly, infogr.am, venngage, etc. Most will allow you to sign up for free with limited features and access. For example, I used Canva.com to create the student guide. You can also use programs such as Gimp, Publisher, and Photoshop, but they require more expertise, effort, and time.
- Top Tips from Experts on What Makes a Great Inforgraphic
- What Makes a Good Infographic?
- How to Create 5 Fabulous Infographics in Powerpoint
Many sites exist such as visual.ly, canva, piktochart, easel.ly, infogr.am, venngage, etc. Most will allow you to sign up for free with limited features and access. For example, I used Canva.com to create the student guide. You can also use programs such as Gimp, Publisher, and Photoshop, but they require more expertise, effort, and time.
